• Work
  • About
Menu

Aonghas Crowe

  • Work
  • About
DSC04547.jpg
Unemployment rate in Okinawa since its return to Japan in 1972.

Unemployment rate in Okinawa since its return to Japan in 1972.

Unemployment in Okinawa

May 24, 2021

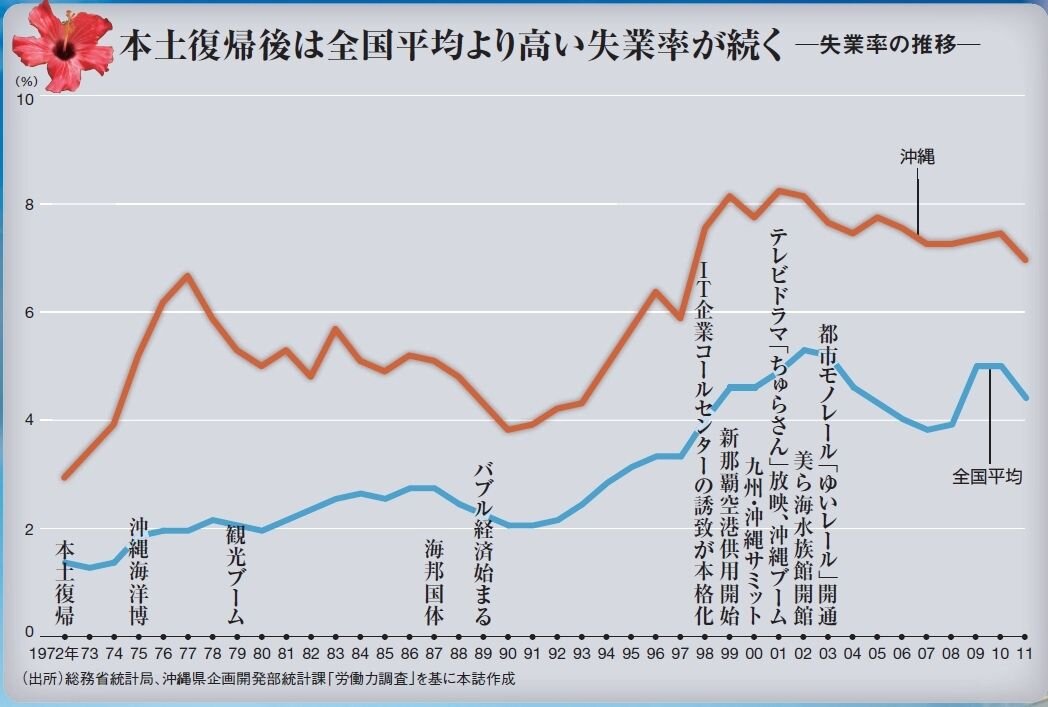
Shortly after becoming a prefecture again, unemployment in Okinawa more than doubled from 3% to almost 7%. The average rate in the Japan at the time was 2%. The Amami archipelago also experienced economic hardship when it was "returned" to Kagoshima prefecture in 1953 and was one reason Okinawa was originally cool to the idea of reunification with Naichi (mainland Japan). (I will expand upon this at a later date.)

During the '80s unemployment fell steadily, but rose sharply in the 90s after the asset bubble had burst. Despite a number of public works projects--a new airport in '99 (You should have seen the old one--yikes!), the Yui Rail monorail in Naha in 2003, highway E58 (“goya”) which has been built piecemeal over the past fifty years, the TV drama "Chura-san", which ushered in the "Okinawa Boom", unemployment has remained much higher than the nation's average.

Today, however, things have improved considerably. In December of 2020 unemployment stood at 2.9% nationally and only slightly higher at 3.4% in Okinawa. Among 15~29 year olds, the rate was 5.2% locally, compared to 4.5% nationwide. Mind you, that is during the Covid-19 pandemic which has hit the tourism industry hard.

Red line is Okinawa; blue, national average. R1 is 2019; R2, 2020.

Red line is Okinawa; blue, national average. R1 is 2019; R2, 2020.

I have been asked why unemployment shot up after the return of the islands to Japan.

I believe a lot of local Okinawans lost jobs they had on the bases. One site says that some 19,000 locals had been employed by the US government, which doesn't sound like a whole lot, but the population of Okinawa was only 970,000 at the time. The labor force at the time was 370,000 people. 20,000 amounts to about 5.5% of the labor force. There were also troop reductions which probably had further knock-on effects to the local economy. Unemployment rose for the whole country at the time, too.

The bases accounted for about 16% of the local economy in 1972. Today that figure is a healthier 5.3%.

In Japanese History, Economy Tags Okinawa, Unemployment in Japan, Unemployment in Okinawa, Public Works in Okinawa
Comment
Hogo+Shitsugyo.jpg.gif

Unemployment and Welfare in Japan

February 11, 2021

While this is old news, it is still interesting. (I will try to find more up-to-date stats later.)

The upper graph shows the persentage of people in each prefecture who received welfare benefits (生活保護, seikatsu hogo) in 2010. Starting from the left, the rate for the entire nation (全国) is 15.2%. Next is Hokkaidô (北海道) at a whopping 29%. Aomori, 20.8%. 19.5% of the residents of Tōkyō (東京) are on welfare; 15.3% in Kanagawa (神奈川). Ōsaka (大阪) has the largest number of welfare recipients at an unbelievable rate of 32%, meaning some 2.8 million people in the prefecture are receiving benefits. Kōchi (高知) on the island of Shikoku has a rate of 26%. In the prefecture of Fukuoka, where I live, 24.1% of the population is getting government aid, the fourth highest in the nation. Interestingly, in neighboring Saga prefecture (佐賀) the rate is only 8.7%.

The red line indicates what the rate was in 1997. In every single prefecture the rate went up, in many cases doubling.

2010 was not a bumper year in Japan. Thanks the what the Japanese call "The Lehman Shock" (and I call "The Panic of 2007-2008"), the official unemployment rate was at its highest level since the 2002 recession following the 9/11 terrorist attacks. It has since come down and now hovers between 3.5% and 4%, or at about the same level that was seen in 1997 when the Asian financial crisis threatened a global economic meltdown. (So many economic crisises are bad for the heart.) I would think that the percentage of those who are receiving welfare benefits today has also come down. (I'll have to look into that.)

One thing that struck me, actually several things did, but one thing that impressed me is how larger, vibrant cities like Fukuoka had such high welfare rates, while places like Saga which, I'm sorry to say, don't have a whole hell of a lot going for them—the same could be said of Hokuriku (Toyama 富山, Ishikawa 石川, etc.)—have such low rates. My theory for this is that the younger stratum of the population has left for bigger cities to look for work, lowering the welfare rates of their home towns, but raising them in the cities. (Visit Saga city on a Sunday afternoon and I challenge you to try to find a person in his or her 20s. They just aren't there.)

The second graph shows unemployment rates on the X axis and welfare rates on the Y axis. As one might suspect, there is a positive correlation between the two: the higher the unemployment rate, chances are the welfare rate will also be high. Fukuoka (福岡), again, had the fourth highest rates in the country in 2010. 

Here is information from 2018:

スクリーンショット 2021-02-11 11.08.57.png
スクリーンショット 2021-02-11 11.09.16.png
スクリーンショット 2021-02-11 11.09.47.png
In Economy, Trends in Japan Tags Unemployment in Japan, Welfare in Japan, Recession in Japan, Lehman Shock
Comment
IMG_2610.JPG

Your Tax Dollars at Leisure

December 9, 2020

Although I was once a "Young Republican", today I consider myself a moderate Libertarian†. I can appreciate the need for Keynesian-style stimulus spending in times of recession and higher taxes to help reduce budget deficits, BUT nothing brings out my inner curmudgeon quite like seeing government money, my taxes, going to waste. 

Two years ago I posed some questions for our newly elected mayor. One of them was: "Throughout Japan, and in Fukuoka, too, many historical spots are indicated by little more than concrete posts stating that this is the location that such and such happened. This is a missed opportunity to make the history live, to build authentic sightseeing spots. How can Fukuoka better highlight its historical heritage?" I also asked: "Many of the parks are poorly maintained. Gardeners come in only once every few months, hack at the weeds, trim limbs, and then leave the parks to be overrun with weeds, garbage, and the homeless once again. What can the city do to better maintain these areas, to make them places people would be happy to visit?"

Now, I'll be damned if in two short years the city didn't go on to address both of these issues head on. Maizuru Park where the ruins of Fukuoka Castle are located now has a regular crew of gardeners (most of whom are mentally retarded*) which tends to the flower boxes and generally keeps the park clean. And this visitor center located in the park was recently opened. Progress!

I have two problems with the center, though. One is the design which has nothing to do with Fukuoka Castle or the other structures in the area.

IMG_2611.jpg

For instance, all of the restrooms in the park look like this:

IMG_2612.JPG

White washed walls, known as shirakabe (白壁) with a gray border along the bottom half, reminiscent of townhouses in the Edo and Meiji eras.

Why didn't the city build a visitor center in this or a similar style, something that would have been both interesting for tourists to see and would have been in keeping with the previously established theme? The architectural style of this new building has nothing to do with the culture of Japan or Fukuoka. It's a missed opportunity, to say the least.

The second, and bigger, of the two problems with the visitor center is the price. How much do you think it cost?

Take a wild guess? Make it wilder . . . You're still cold. You're not even close, my friend.

The Fukuoka Jō Mukashi Tanbōkan ((福岡城むかし探訪館)) cost a whopping 70 to 80 million yen to build. (The Yomiuri Shimbun has the price at "about 70 million", and NHK reported recently that the center cost 78 million yen.) In dollars that comes to between $875,000 ~ $975,000. Almost a million bucks! And that is for the structure alone. The city didn't need to buy the land (usually the most expensive part of a structure) it was built upon. Imagine what your home would look like if you had put that much money into its construction. It would be fitted with saunas and Jacuzzis, heated floors, an elevator for your cars, a gorgeous designer kitchen, a wine cellar, living quarters for the help, and so on.

Obviously someone made a killing off of this little projects and it worries me to no end that the citizens of this city don't rise up and voice their disgust and anger. Instead, they just shrug.

The consumption tax is going to be doubled in a number of years, but as long as projects like these continue to waste money hand over fist Japan's massive public debt will never be addressed.

Your tax dollars at leisure.

Originally posted in 2012.

___________________________ 

†There is an excellent online tool which plots your opinions on political and economical matters on a "compass" and compares them with the policies and beliefs of political leaders, past and present.

Winston Churchill reportedly said, "If you aren't liberal at 20, you haven't got a heart; if you aren't conservative at 40, you haven't got a head." If that is true, then I was a heartless youth, and today at the age of 46 I am not sufficiently curmudgeonly for my age.

*By the way, you can holster your offense at my use of the word "retarded": one of my sisters was (she has already passed away), and two of my cousins are "mentally retarded". My sister’s case was so severe, she couldn’t say much more than “Ma-ma-ma-ma.” We all miss her.

In Economy, Japanese Architecture, Life in Fukuoka Tags Fukuoka Jō Mukashi Tanbōkan, 福岡城むかし探訪館, Fukuoka Castle
Comment
Wild+Wild+West.jpg

Japan's Wild West

September 9, 2020

Despite consistently ranking as one of best cities in the world to live, shop, or eat, Fukuoka also has a reputation among the Japanese as being one of the wildest, most dangerous places in the entire country. Because of its reputation for violence and crime, the prefecture has been called “Ashura no Koku” (阿修羅の国).[1]

So, why the bad rap?

For one, Fukuoka prefecture often tops the country in number of shootings and bombings with hand grenades—yes, that’s hand grenades. The prefecture also has the ignominy of being a leader in accidents caused by drunk drivers. The rate of burglary is high, as is the total number, and the rate, of sex crimes, and so on.[2]

The cause of the high level of crime has been attributed to the large number of organized crime syndicates operating in the prefecture, its proximity to the Sea of Japan, which is said to facilitate smuggling and exile, and tougher anticrime measures in Kantō and Kansai.


[1] Ashura in Buddhism is the name of the lowest ranking deities of the Kāmadhātu (Buddhist cosmology). They are described as having three heads with three faces and four to six arms. The state of an Asura reflects the mental state of a human being obsessed with ego, force and violence, always looking for an excuse to get into a fight, angry with everyone and unable to maintain calm or solve problems peacefully. (Wikipedia)

[2] *Fukuoka also has the highest rate in Japan of unmarried women in their 20s and 30s. This is supposed to be a “bad thing”, but personally, I believe it adds to the city's livability.


From Awabi.2ch.net:
福岡県内一万人あたりの犯罪率上位20位(2012) 
{()内は左から前年度順位、前年度犯罪率、地域区分} 


1(1) 粕屋町 216.36(250.42)(福岡地方) 
2(5) 田川市 206.87(175.84)(筑豊地方) 
3(4) 苅田町 194.41(178.84)(北九州地方) 
4(6) 福岡市 179.13(174.12)(福岡地方) 
5(10)志免町179.05(164.50)(福岡地方) 
6(9) 川崎町 176.34(165.01)(筑豊地方) 
7(8) 直方市 175.73(168.34)(筑豊地方) 
8(3) 飯塚市 171.02(187.60)(筑豊地方) 
9(33)赤村   165.94(115.05)(筑豊地方) 
10(24)古賀市163.81(132.98)(福岡地方) 
11(14)水巻町161.25(144.69)(北九州地方) 
12(32)築上町155.31(117.26)(北九州地方) 
13(20)大任町153.42(135.11)(筑豊地方) 
14(11)新宮町150.49(155.31)(福岡地方) 
15(2) 小竹町 149.42(210.12)(筑豊地方) 
16(18)福智町149.30(141.38)(筑豊地方) 
17(17)遠賀町147.86(143.19)(北九州地方) 
18(13)中間市146.62(145.34)(北九州地方) 
19(21)行橋市143.60(134.73)(北九州地方) 
20(27)みやこ町141.17(126.87)(北九州地方) 


福岡の真の姿 


1)ひたすら他力本願の支店植民地奴隷。 
2)地元の全国的有名企業はゼロ。 とにかくゼロ。 
3)九州の人口背景をバックに国や企業が作ったものを福岡市単独の力だと自慢する。 
4)地元から日本に影響を与えるような文化・流行発信能力はゼロ。 
5)福岡ラブコレクションに代表されるように他都市が発信したものを福岡が発信としてパクル。 
6)九州内の他県、他都市を田舎モンと蔑む(特に熊本市や北九州市)。自分もカッペなのには気づいていない。 
7)他都市は決して認めない。負けそうになると人格攻撃や論点をそらしてごまかす。卑怯な気質。 
8)とにかく自画自賛や自己過大評価がすごい。過去の武勇伝を得意げに語り自分を誇示したがる。 
9)天神をとにかく異常に過大評価する。超高層ビルへのコンプレックスは日本一 
10)高層ビルがないのは空港があるからだと言い訳する(実際は需要自体がない)一方で、 
内陸都市の札幌には港が無いと攻撃する。 
11)他都市の話題でスレが立つとボウフラのように湧き出てその都市に関して必死にネガキャン・こき下ろしを行う。 
12)言う事がなくなるとひたすらオウム返しでごまかす。 
13)社会人では、他人を蹴落として生き残ろうとするあまり、年下相手にも本気で争う。 
14)冗談が通じず些細な事でも顔を真っ赤にして過剰反応を示す。 
15)異常なほど自尊心が高い。自身の非は決して認めない。従って、傷付けられると異常に反応する。加えて執拗である。 
16)極端な地元偏重思考。何でも一番だと思いたがる。 
17)貧困から生じた他人蹴落とし精神によって、他地域を蔑み、蹴落とそうとする。 
18)貧困による権利主張志向により、自動車に対し、歩行者と自転車運転者に『譲り合い精神』が無い。 
19)生活安全面における「福岡市内は県内他地域より安全」説を強く信仰する。 
20)福岡市内における事件ではまず他地域住民のしわざを強く疑う。また、脈絡なく他地域の悪口を言い始め、 
話題を転換しようとしたり「~より福岡市内はマシ」説を唱え始める。 
21)異常なまでにコンプレックスが強く他都市を攻撃する。一方でなぜか福岡市は周りから羨み妬まれてると勘違いしている。 
22)麺類の話題が出ると聞いてもないのに「福岡市では~」「博多では~」とアピールを始める。と同時に他地域の料理を通ぶって批判する。 


福岡が経験してきた偉大な記録集

 
・飲酒運転数全国 1位 
・暴力団増率全国 1位 
・拳銃押収数全国 1位 
・〃発砲事件全国 1位 
・郵便局強盗全国 1位 
・犬猫殺処分全国 1位 
・食品偽装数全国 1位 
・放置自転車全国 1位 
・部落同和数全国 1位 
・生活保護率全国 1位 
・自己破産率全国 2位 
・ひったくり件数全国 1位 
・暴走族数(95族)全国 1位 
・自動販売機破壊全国 1位 
・自動車当て逃げ全国 1位 
・自動車税未納付率全国 1位 
・110番(福岡西署)通報数全国 1位 
・強姦件数(10万人あたり)全国 1位 
・10歳~19歳の非行者率全国 1位 
・未成年薬物検挙8年連続全国 1位 
・最終学歴中卒率政令指定都市 1位

In Economy, Life in Fukuoka Tags Fukuoka Prefecture, Crime in Fukuoka
Comment

the 1 Percent in japan

September 3, 2020

With all the talk in recent years about rising economic inequality in the U.S., I was curious to learn more about what the situation was like in Japan. In researching the issue, I came across an interesting site called heikin shūnyū ("average income", sorry Japanese only) which answers a lot of the questions people have about income and wealth in Japan. I will be translating some of my findings here, so check in on this post from time to time. 


Ten million yen a year

The first thing that caught my eye was the following:

"年収1000万円の手取りはいくらかと言いますと、ざっくりですが700~800万となります。ちなみに全体の中で、年収1000万以上もらえる人は全体の3~4%となりかなり少ないです。"

Take-home pay for someone earning ¥10,000,000 a year (or $84,873 at today's lousy exchange rate) amounts to about ¥7~8,000,000 ($59,000~68,000). Incidentally, only 3-4% earns over ten million yen a year. 3-4% of what is not clarified. I assume it is 3-4% of those who are working and earning an income.

According to another great site, Trading Economics, the labor force participation rate is 59.9%, giving Japan a workforce of 63,660,000 people. So, if I have calculated correctly, about two million people in Japan earn over 10 million yen a year. That would put them squarely in the top 5%, something I find hard to believe as an income of ¥10,000,000 isn't what I'd call "rich". (See below for the actual stats.)


Bragging Rights

How much money would you have to earn for you to feel like you're really raking it in? Minna no Koe ("Everyone's Voice") an online opinion survey run, I believe, by DoCoMo, asked this very question. More than 32,000 people took part in the survey and the results are as follows: 

1. Over ¥10 million 48.8%

2. Over ¥8 million 19.3%

3. Over ¥5 million 12.0%

4. Over ¥20 million 6.3%

5. Over ¥100 million 3.9%

Interestingly, if you look at the answers of those still in their teens, "over ¥5 million a year" drops from third place to sixth and ¥20 million rises to third place. The second most common answer for those in their twenties, however, is "over ¥5 million a year", reflecting perhaps the harsh reality of working life in Japan today.


Who's Making What

In 2010, 45,520,000 people in Japan received a "salary", the largest portion, or 18.1% (8.23 million people), earning between ¥3,000,000 ~ ¥3,999,999 a year. The next largest group, or 17.6% or wage-earners (about 8 million people) earned between ¥2,000,000 ~ ¥2,999,999.

Among men, the largest wage group (19.5% of the total) earned between ¥4,000,000 ~ ¥4,999,999. 26.8% of women earned more than ¥1 million and less than ¥2 million.

¥4,000,000 ~ ¥4,999,999 14.3%

¥5,000,000 ~ ¥5,999,999  9.4%

¥7,000,000 ~ ¥7,999,999  3.9%

¥10,000,000 ~ ¥14,999,999  2.8%

¥15,000,000 ~ ¥19,999,999  0.6%

¥2,500,000 ~   0.2%

Those earning over ¥10,000,000 account for less than 5% of all wage earners, or about 2.27 million people.


"Kakusa Shakai"

Kakusa Shakai (格差社会, "gap-widening society") is a term you're sure to hear on TV when the discussion is about the economic in Japan. Like America, Japan has seen growing income inequality over the past few decades, though it hasn't been as conspicuous. Rather than go into the reasons for the rise in inequality, I would like to note that as of 2010, there were some 800,000 people who could be counted among the "well-to-do", namely, those earning over ¥20 million a year. By comparison, there were more than 20 million Japanese living in poverty.

(This is a rather old post that I have only just now transferred to my new blog. Will try to update the info in coming weeks.)

In Economy, Working in Japan Tags Kakusa Shakai, Income in Japan, Working in Japan
Comment
1948-aladdin-house-mt-vernon.jpg

Average Income and Cost of a New House in the US

May 5, 2020

My mother’s 90th birthday is coming up and the eleven of us surviving kids are trying to come up ideas to make the day a special one, despite the social distancing and lockdowns. One of my sisters found an interesting card that showed what was going on in the US in 1930. There are several versions of these out there, and I wouldn’t mind having one sent to me on my own 90th birthday, if I manage to live that long.

Anyways, I was struck by the cost of a house compared to the average annual income. Have a look:

1920

$3,269; $5,000 (1.5 times)

A house, a modest one perhaps, was within reach of a middle-class worker in the ‘20s.

1930

$1,368; $7,145 (5.2 times)

This is at the start of The Great Depression, which is why the average salary has been slashed. Home prices, interestingly, are up. What’s going on there?

1940

$1,900; $6,500 (3.4 times)

Incomes are still low, but with the start of WWII, things will turn around.

1950

$3,300; $14,500 (4.4 times)

Houses are still expensive compared to income, but that may be a reflection of the demand for housing in the postwar baby-boom era.

1960

$5,600; $16,500 (2.9 times)

Income is rising faster than the price of houses.

1970

$8,734; $26,000 (3.0 times)

Both are rising at about the same level.

1980

$17,710; $76,400 (4.3 times)

From the Reagan era on, the price of houses compared to income starts to increase. I have read that this was the result of more married women entering the workplace, allowing couples to spend more on housing than they otherwise would have. Warren talks about this a lot.

1990

$29,943; $149,800 (5 times)

More of the same. Housing prices keep going up, up, up and were back at Depression Era levels, only the dual incomes have made people numb it.

2000

$40,343; $134,150 (3.3 times)

A return to sanity, or just a breather?

2010

$49,276; $272,517 (5.5 times)

As I suspected, house prices are bonkers again.

In Economy Tags Housing in the US, Housing Market, Average Annual Salary in US
1 Comment
inc_map_of_japan.jpg

Corporate Japan

December 29, 2018

A few years back someone posted an infograph of the “Corporate States of America” with the most representative/iconic companies based in each state. Now someone has done that with Japan. Have a look.

Hokkaidō: ニトリ (Nitori, interior/furniture retailer) and 六花亭 (Rokkatei, confectioner/chocolate)

Aomori: サンデー (Sunday, home center/DIY)

Iwate: 薬王堂 (Yaku Ōdō, drugstore chain)

Miyagi: アイリスオーヤマ (Iris Ohyama, maker/seller of household plastic products)

Akita: たけや製パン (Takeya Seipan, maker of bread and western-style sweets and cakes)

Yamagata: でん六山形県山形市に本社を置く菓子メーカー

Fukushima: ヨークベニマルスーパーマーケットチェーンを展開する福島県郡山市の企業

Ibaraki: ケーズホールディングス茨城県水戸市に本社を置き「ケーズデンキ」の屋号で家電量販店をチェーン展開

Tochigi: コジマ栃木県宇都宮市に本社を置く家電量販店チェーン

Gunma: ヤマダ電機群馬県高崎市に本社を置く家電量販店チェーン

Saitama: 赤城乳業埼玉県深谷市に本社を置くアイスクリーム専業メーカー千葉県イオン「イオングループ」を統括する純粋持株会社

Tōkyō: NTT東京都千代田区に本社を置く日本の通信事業最大手であるNTTグループの持株会社

Kanagawa: 崎陽軒本社を神奈川県横浜市に置き主にシウマイの製造販売ならびにレストラン事業を展開

Niigata: 亀田製菓新潟県新潟市に本社を置き主にせんべいなどの米菓の製造を手掛ける企業

Toyama: 光岡自動車富山県富山市に本社を置く自動車メーカー

Ishikawa: アイ・オー・データ機器石川県金沢市に本社を置く精密機器メーカー福井県増永眼鏡福井県福井市に本社を置く眼鏡フレームの老舗メーカー

Yamanashi: 富士急行山梨県富士吉田市に本社を置き運輸・観光・不動産・流通事業などを行なう会社

Nagano: セイコーエプソン長野県諏訪市に本社を置く情報関連機器・精密機器のメーカー

Gifu: 西濃運輸路線トラック業界最大手で岐阜県大垣市に本社を置く運輸会社

Shizuoka: ヤマハ静岡県浜松市に本社を置く楽器・半導体・自動車部品製造発売を手がけるメーカー

Aichi: トヨタ自動車愛知県豊田市に本社を置く自動車メーカー

Mie: 井村屋三重県津市に本社を置く菓子メーカー

滋賀県近江兄弟社滋賀県近江八幡市に本社を置く医薬品メーカー

京都府任天堂京都府京都市に本社を置く家庭用レジャー機器の製造・販売を行う企業

大阪府パナソニック大阪府門真市に本社を置く世界的な総合電機メーカー

兵庫県川崎重工業兵庫県神戸市に本社を置き二輪車・航空機・鉄道車両・船舶等を製造する企業

奈良県呉竹本社は奈良県奈良市にあり書道用の墨汁・筆・硯などで知られるメーカー

和歌山県オークワ和歌山県和歌山市に本社を置き8つの府県で展開しているチェーンストア

鳥取県寿製菓鳥取県米子市に本社を置く菓子メーカー

島根県一畑電気鉄道島根県松江市に本社を置き交通・観光・流通・建設等の事業を展

開岡山県ベネッセコーポレーション岡山県岡山市に本社を置き通信教育・出版などの事業を行なう企業

広島県マツダ広島県安芸郡府中町に本社を置く自動車メーカー

山口県ユニクロ山口県山口市に本社を置き衣料品の生産販売を一括して展開する企業

徳島県日亜化学工業徳島県阿南市に本社を持ち発光ダイオードなどの電子デバイス扱う化学会社

香川県日プラ香川県木田郡三木町にあるアクリルパネルメーカー

愛媛県大王製紙愛媛県四国中央市に本社を置く独立系大手製紙メーカー

高知県キタムラ高知県高知市に本社を置く写真用品店チェーン

福岡県ゼンリン福岡県北九州市に本社を置く日本最大手の地図制作会社

佐賀県久光製薬佐賀県鳥栖市に本社を置く医薬品メーカー長崎県ジャパネットたかた

長崎県佐世保市に本社を置く通信販売会社

熊本県再春館製薬所熊本県上益城郡益城町に本社を置く化粧品・医薬品・医薬部外品の通信販売業の企業

大分県ジョイフル本社を大分県大分市に置き九州を中心にファミリーレストランをチェーン展開

宮崎県宮崎交通宮崎県宮崎市に本社を置きバス事業などを展開

鹿児島県セイカ食品鹿児島県鹿児島市に本社を置く総合食品製造メーカー

沖縄県オリオンビール沖縄県浦添市に本拠を置く大手ビールメーカー


In Economy Tags Japanese Companies, Corporate Japan, Japan Inc.
Comment
Childhood+Poverty+Rates+by+Prefecture.png

Childhood Poverty in Japan

November 7, 2018

There has been much handwringing of late with regard to the childhood poverty rate in Japan. This is something I would like to address in future posts, but for now I want to share a graph I found which shows childhood poverty rates by prefecture.

Overall, Japan has a childhood poverty rate of 13.8%, considerably less than America's rate of 21%. But looking at individual prefectures, we find that the poverty rate of Okinawa, the nation's worst, is 37.5%. Ōsaka has the second highest childhood poverty rate at over 20%. Kagoshima is third and my prefecture of Fukuoka is fourth with just under 20%, meaning one in five kids is living in poverty. Sobering statistics, to say the least.

For some albeit dated perspective, here is how Japan compares to other countries in the OECD. On average, 13.4% of children in OECD countries live in “relative income poverty”, which is defined “as the percentage of children (0-17 year-olds) with an equivalised household disposable income (i.e. an income after taxes and transfers adjusted for household size) below the poverty threshold. The poverty threshold is set here at 50% of the median disposable income in each country.”

https---blogs-images.forbes.com-niallmccarthy-files-2016-01-20160104_Child_Poverty_Fo_02.jpg
In Economy, Life in Japan Tags Childhood Poverty in Japan, Childhood Poverty, Poverty, OECD Childhood Poverty Rates
Comment
Kurosaki+IMG_4352+2.jpg

Kurosaki

October 23, 2018

Two decades ago the Kurosaki's shopping arcade was hopping with shoppers. Today, it is virtually bedridden . . . with pneumonia and bedsores.

Over a quarter of a million people live in Kitakyushu's Yahata Nishi Ward, and yet the heart of that ward feels like a cold wet stone.

The culprit? An AEON shopping mall located one station over. I was hearted to hear that local governments have finally wised up to how destructive those malls can be to local economies, often wiping out generations of businesses in one fell swoop.

In Economy, Trends in Japan Tags Kurosaki, 黒崎, 北九州, Kitakyushu, Shutters, AEON
Comment
c601f866.png

Per Cap. GDP by Prefecture

September 19, 2018

1. 東京都 692.60万円

Tokyo, $61,839

Tokyo’s economy is massive, almost as large as that of the Republic of Korea, the fifteenth largest economy in the world, and larger than Indonesia, Colombia, and many other countries.

2. 愛知県 426.96万円

Aichi, $38,121

3. 滋賀県 426.22万円

Shiga, $38,055

4. 静岡県 418.75万円

Shizuoka, $37,388

5. 大阪府 410.42万円

Osaka, $36,645

Osaka’s economy is about the same size of the U.A.E.’s.

6. 福井県 409.80万円

Fuki, $36,589

7. 富山県 399.82万円

Toyama, $35,698

8. 三重県 397.20万円

Mie, $35,464

9. 山口県 396.42万円

Yamaguchi, $35,395

10. 栃木県 388.84万円

Ibaraki, $34,718

11. 広島県 377.77万円

 Hiroshima

12. 茨城県 376.70万円

 Ibaraki

13. 長野県 372.86万円

 Nagano

14. 群馬県 369.92万円

 Gunma

15. 石川県 364.53万円

 Ishikawa

16. 岡山県 363.24万円

 Okayama

17. 新潟県 362.55万円

 Niigata

18. 山梨県 361.88万円

 Yamanashi

19. 徳島県 359.24万円

 Tokushima

20. 大分県 358.65万円

Oita

21. 香川県 358.53万円

 Kagawa

22. 福岡県 355.72万円

Fukuoka, $31,761

23. 京都府 355.58万円

 Kyoto

24. 福島県 351.21万円

 Fukushima

25. 和歌山県 349.60万円

 Wakayama

26. 宮城県 342.63万円

 Miyagi

27. 愛媛県 341.58万円

Aichi’s economy is slightly larger than Denmark’s, the 34th largest economy in the world. I read somewhere that a majority of Japan’s export dollars are earned in Aichi, which is home to Toyota.

28. 岐阜県 340.85万円

 Gifu 

29. 佐賀県 337.41万円

 Saga

30. 北海道 334.69万円

 Hokkaido

31. 神奈川県 328.88万円

Kanagawa’s economy is somewhat bigger than Singapore’s, the 36th largest economy in the world.

32. 兵庫県 328.31万円

Hyogo

33. 青森県 325.93万円

 Aomori

34. 秋田県 324.68万円

 Akita

35. 島根県 324.27万円

 Shimane

36. 山形県 319.85万円

 Yamagata

37. 鹿児島県 319.23万円

Kagoshima, $31,181

38. 鳥取県 311.71万円

Tottori, $27,831

39. 宮崎県 308.11万円

Miyazaki, $27,510

40. 岩手県 308.05万円

Iwate, $27,505

41. 長崎県 306.73万円

Nagasaki, $27,387

42. 熊本県 306.00万円

Kumamoto, $27,321

43. 千葉県 305.76万円

Chiba, $27,568

44. 高知県 282.46万円

Kochi, $25,220

45. 埼玉県 279.47万円

Saitama, $24,953

46. 沖縄県 267.48万円

Okinawa, $23,882

47. 奈良県 253.53万円

Nara, $22,637

In Economy Tags Per Capita GDP, Prefectural Economy
Comment

Latest Posts

Subscribe

Sign up with your email address to receive news and updates.

We respect your privacy.

Thank you!
Blog RSS

Blog

Featured
que-12241102027.jpg
Mar 26, 2025
 Meiji Modernization and German Influence
Mar 26, 2025
Mar 26, 2025
Screenshot 2025-02-04 at 6.21.14.png
Feb 4, 2025
Risshi-Shiki
Feb 4, 2025
Feb 4, 2025
政党の変遷_20181001.jpg
Nov 3, 2024
Japan's Political Parties
Nov 3, 2024
Nov 3, 2024
EB9D8A29-A874-400F-9D59-619E85CFD8C5.png
Sep 9, 2024
Keio JR High School’s Entrance Exam
Sep 9, 2024
Sep 9, 2024
Sinburyou.jpg
Mar 25, 2024
Shinburyo
Mar 25, 2024
Mar 25, 2024
GH1mAHXXUAAaJgc.png
Mar 18, 2024
Survival Japanese
Mar 18, 2024
Mar 18, 2024
Usui.jpg
Feb 20, 2024
Usui
Feb 20, 2024
Feb 20, 2024
images.png
Feb 16, 2024
Blue Bottle
Feb 16, 2024
Feb 16, 2024
Screenshot 2024-02-13 at 8.32.52.png
Feb 13, 2024
Private Schools
Feb 13, 2024
Feb 13, 2024
Screenshot 2024-02-05 at 8.58.03.png
Feb 5, 2024
Love Hotels
Feb 5, 2024
Feb 5, 2024

INSTAGRAM

View fullsize All ready for Thanksgiving.

#shochu #imojochu #焼酎 #いも焼酎
View fullsize Display Cases of Kyoto
View fullsize Inuyarai in Kyōto 

京都の犬矢来

Found under the eaves of townhouses (machiya) in Kyoto and along the road, inuyarai were originally made of split bamboo. In modern times, however, they are sometimes made of metal. The original purpose of the arched barri
View fullsize Walls in Gokusho Machi, Hakata
View fullsize The 15th of August is the last day of the Bon Festival of the Dead, Japan’s version of Dia de muertos. On this day, Japanese say goodbye to the spirits of their ancestors. Today I say goodbye to my last drop of Yamato Zakura Beni Imo 35%. Forgi
View fullsize Azaleas at Fukuoka’s Kushida Shrine 

#櫛田神社 #Kushida #springinjapan #Fukuoka
View fullsize Mugon (Tacit, lit. Without Words) rice shōchū genshu from Sengetsu Distillery of Hitoyoshi, Kumamoto. Aged in cypress casks, I believe, it retains that telltale hinoki scent. I normally don’t drink Kuma-jōchū, but this is lovely. I’ll buy
View fullsize Another one of my somewhat hard-to-find favorites. Sang Som from Thailand. So smooth. I used to keep a bottle of it at Gamaradi before the pandemic. May have to do so again. Missed it. Missed Mr. Chang.
View fullsize First drink of the New Year is the best find of the past year: 

Yaesen Shuzō genshu #awamori from #Ishigaki Island. Aged in oak barrels, it has the nose of whiskey, the mellow sweet taste of a dark rum. At ¥5000 a bottle, it’s rather price
View fullsize Santa arrived early and just in time for Labor Thanksgiving Day 🇯🇵 

Two bottles of imo shōchū—one is a favorite, the other an interesting find I happened across during a short visit last summer to the Koshiki archipelago off the western coas
View fullsize Mission accomplished!

Dropped by the new Flugen in Hakata to drink one of my all-time favorite spirits, the somewhat hard-to-fine-but-worth-the-search Linie Aquavit from Norway.

#Flugen #Aquavit #Hakata
View fullsize Two or three weeks ago a friend invited me to join him at a big shōchū and awamori wingding at #FukuokaDome. Ended up buying about ten bottles of booze which I have stashed away at the in-laws’ for safekeeping. Of all the things I bought, this
View fullsize Takumi has once again included Maō in one of their #shochu box sets. At ¥5550, it’s not a bad deal. 

Kannokawa genshū—another favorite of mine made with anno sweet potates from Tanegashima—sold me. Ended up buying two. 

#かんぱい
View fullsize A little present to myself to mark the midpoint of the semester. Easy coasting from here.

Cheers and kampai!

#いも焼酎 #imoshochu #shochu #大和桜 #YamatoZakura
View fullsize Naha, Okinawa

#マンホール #Manhole #Naha #Okinawa #shisa #シーシャ
View fullsize At American Village in Chatan, Okinawa.

#北谷 #マンホール #沖縄 #Manhole #Chatan #Okinawa
View fullsize Final bout lasted 8 seconds. So, I guess it’s safe to say we’ve got that fickle momentum back.

#Karate #空手 🥋 #Kumite #組手
View fullsize 京都ぶらぶら

A long, slow walk through Kyōto
View fullsize 京都ぶらぶら

Kyōto stroll
View fullsize Always good to visit with my fellow traveler.

Gourmets of the world unite!
IMG_3919.jpg

KAMPAI Blog

Featured
Screenshot 2024-02-07 at 17.39.19.png
Feb 7, 2024
60 : 35 : 5
Feb 7, 2024
Feb 7, 2024
1614050579_3.jpg
May 15, 2023
Satsuma Imo Motogusare Disease
May 15, 2023
May 15, 2023
Seifuku Imuge.jpeg
Jun 22, 2021
Seifuku's Imugé
Jun 22, 2021
Jun 22, 2021
May 24, 2021
Kachaashii
May 24, 2021
May 24, 2021
MCHS1968.jpeg
May 16, 2021
Destine
May 16, 2021
May 16, 2021
Apr 26, 2021
Moriawaro
Apr 26, 2021
Apr 26, 2021
Mar 3, 2021
Kampai Shanshan
Mar 3, 2021
Mar 3, 2021
IMG_2395.jpeg
Jan 28, 2021
Mitake Genshu
Jan 28, 2021
Jan 28, 2021
Kikoji.jpeg
Jan 27, 2021
Kokubu Kikoji Kura
Jan 27, 2021
Jan 27, 2021
Hakaio.jpeg
Jan 15, 2021
Hakaio
Jan 15, 2021
Jan 15, 2021
rokuban+wing+2.jpg

Too Close to the Sun

Featured
Feb 20, 2019
80. Why the long face?
Feb 20, 2019
Feb 20, 2019
Feb 20, 2019
79. The Itch
Feb 20, 2019
Feb 20, 2019
Jan 24, 2019
78. Soaring
Jan 24, 2019
Jan 24, 2019
Jan 23, 2019
77. Yaba Daba Doo!
Jan 23, 2019
Jan 23, 2019
Jan 3, 2019
76. Let's Make a Deal
Jan 3, 2019
Jan 3, 2019
Nov 22, 2018
75. The Pied Piper of Patpong
Nov 22, 2018
Nov 22, 2018
Nov 16, 2018
74. Ping Pong Pussy
Nov 16, 2018
Nov 16, 2018
Oct 18, 2018
73. Yaba
Oct 18, 2018
Oct 18, 2018
Oct 16, 2018
72. Lightning Strikes Twice
Oct 16, 2018
Oct 16, 2018
Oct 10, 2018
71. Contacting De Dale
Oct 10, 2018
Oct 10, 2018
A Woman's Tears.jpg

A Woman's Tears

Featured
Apr 2, 2018
18. Just When I Stop Looking
Apr 2, 2018
Apr 2, 2018
Apr 1, 2018
17. Catch and Release
Apr 1, 2018
Apr 1, 2018
Mar 29, 2018
16. Nudging Destiny
Mar 29, 2018
Mar 29, 2018
Mar 25, 2018
15. HAKATA RESTORATION PROJECT
Mar 25, 2018
Mar 25, 2018
Mar 20, 2018
14. Reversible Destiny
Mar 20, 2018
Mar 20, 2018
Mar 12, 2018
13. Graduation
Mar 12, 2018
Mar 12, 2018
Mar 12, 2018
12. Reading Silence Aloud
Mar 12, 2018
Mar 12, 2018
Mar 7, 2018
11. Shut Out
Mar 7, 2018
Mar 7, 2018
Mar 6, 2018
10. The Second Night
Mar 6, 2018
Mar 6, 2018
Feb 28, 2018
9. At the farmhouse
Feb 28, 2018
Feb 28, 2018

Silent Ovation

Featured
Ovation.11.png
Feb 27, 2024
11. High School
Feb 27, 2024
Feb 27, 2024
Screenshot 2024-02-11 at 4.25.37.png
Feb 11, 2024
10. Taichiro Remarries
Feb 11, 2024
Feb 11, 2024
Screenshot 2024-02-05 at 6.24.29.png
Feb 5, 2024
9. Death of My Father
Feb 5, 2024
Feb 5, 2024
hand1.gif

A Woman's Hand

Featured
Jan 24, 2019
52
Jan 24, 2019
Jan 24, 2019
Jan 24, 2019
51
Jan 24, 2019
Jan 24, 2019
Jan 23, 2019
50
Jan 23, 2019
Jan 23, 2019
Jan 3, 2019
49
Jan 3, 2019
Jan 3, 2019
Nov 22, 2018
48
Nov 22, 2018
Nov 22, 2018
unnamed-1.jpg

A Woman’s Nails

Featured
CHHn-rqUIAA4iPq.jpg
Feb 21, 2021
14. Nekko-chan
Feb 21, 2021
Feb 21, 2021
71e7595d28eb0d7d76becf80c766aba2_3.jpg
Feb 20, 2021
13. Tatami
Feb 20, 2021
Feb 20, 2021
Feb 18, 2021
Yoko (Extended Version)
Feb 18, 2021
Feb 18, 2021
197512.jpg
Feb 18, 2021
11. Yoko
Feb 18, 2021
Feb 18, 2021
Feb 17, 2021
10. Yumi
Feb 17, 2021
Feb 17, 2021
00006204.jpg
Feb 16, 2021
9. Mie
Feb 16, 2021
Feb 16, 2021
aonghascrowe-reina-2.jpeg
Feb 11, 2021
8. Reina
Feb 11, 2021
Feb 11, 2021
mie-6.jpg
Feb 10, 2021
7. Mie
Feb 10, 2021
Feb 10, 2021
aonghascrowe-reina-3_4.jpg
Feb 4, 2021
6. Reina
Feb 4, 2021
Feb 4, 2021
abeoto-gravure-image5-52.jpg
Feb 3, 2021
5. Machiko
Feb 3, 2021
Feb 3, 2021
Schechter.Bavel_.TowerofBavel.jpg

HOGEN/Dialect

Featured
Uwabaki.2.jpg
Apr 17, 2024
Uwabaki
Apr 17, 2024
Apr 17, 2024
chinsuko.jpg
Apr 9, 2024
Chinsuko
Apr 9, 2024
Apr 9, 2024
Scan.jpeg
Mar 17, 2024
The Snack with 100 Names
Mar 17, 2024
Mar 17, 2024
Minsa Ori.1.jpg
Feb 26, 2024
Minsa Ori
Feb 26, 2024
Feb 26, 2024
71a4db62b521cf61e57d092101ed1615.jpg
Feb 7, 2024
Taicho ga Warui
Feb 7, 2024
Feb 7, 2024
DTa7CejVoAAGPWU.jpg
Aug 17, 2023
Hashimaki
Aug 17, 2023
Aug 17, 2023
img01.png
Aug 16, 2023
Dialects of Japan
Aug 16, 2023
Aug 16, 2023
town20191010201613_large.jpg
Aug 16, 2023
Yoso vs Tsugu
Aug 16, 2023
Aug 16, 2023
IMG_0831.jpeg
Aug 13, 2021
Uchinaguchi nu Arinkurin
Aug 13, 2021
Aug 13, 2021
Mar 18, 2021
Kampai Shanshan
Mar 18, 2021
Mar 18, 2021
Articles.jpg

Articles

Featured
GPBlog_SummerHomework(GaijinPot_iStock-1024x640.jpg
Aug 27, 2021
With Friends Like These
Aug 27, 2021
Aug 27, 2021
スクリーンショット 2021-06-11 20.22.21.png
Jun 13, 2021
2 Seasons
Jun 13, 2021
Jun 13, 2021
952-LW-illo.jpg
Apr 14, 2019
High Time for Summer Time
Apr 14, 2019
Apr 14, 2019
onomatopoeia.jpg
Jun 18, 2018
Potsu Potsu: Japanese Onomatopoeia and the Rain
Jun 18, 2018
Jun 18, 2018
point-card-lead.jpg
May 19, 2018
Point Break
May 19, 2018
May 19, 2018
last-word-01-860x480.jpg
May 2, 2018
F.O.B. & A-Okay
May 2, 2018
May 2, 2018
Cathay.fukuoka-guide.jpg
Apr 4, 2018
Fukuoka Guide: Spring 2018
Apr 4, 2018
Apr 4, 2018
IMG_4503.jpg
Feb 12, 2018
Woman Kinder-rupted
Feb 12, 2018
Feb 12, 2018
expo_25.jpg
Feb 11, 2018
Summer of Loathing
Feb 11, 2018
Feb 11, 2018
Electtttt-2.jpg
Feb 11, 2018
Election Primer
Feb 11, 2018
Feb 11, 2018

Play With Me

Featured
IMG_0541.jpg
Jan 21, 2018
Jan 21, 2018
Jan 21, 2018
IMG_1318_2.jpg
Jan 21, 2018
Jan 21, 2018
Jan 21, 2018
IMG_1319_2.jpg
Jan 21, 2018
Jan 21, 2018
Jan 21, 2018

Please Write

Featured
IMG_0862.jpg
Jan 21, 2018
Jan 21, 2018
Jan 21, 2018
IMG_1145_2.jpg
Jan 21, 2018
Jan 21, 2018
Jan 21, 2018
IMG_1417.jpg
Jan 21, 2018
Jan 21, 2018
Jan 21, 2018
1000 Awesome Things About Japan

1000 Awesome Things About Japan

Featured
Peas and rice.jpeg
Feb 26, 2020
8. Peas Gohan
Feb 26, 2020
Feb 26, 2020
Finders, Keepers.jpg
Jan 16, 2019
7. Finders, Returners
Jan 16, 2019
Jan 16, 2019
Things+Love+About+Japan.6.1.jpg
Oct 10, 2018
6. No Guns
Oct 10, 2018
Oct 10, 2018
Lockers+IMG_8310.jpg
Oct 10, 2018
5. Coin Lockers
Oct 10, 2018
Oct 10, 2018
IMG_5676.JPG
Sep 11, 2018
4. Sentō
Sep 11, 2018
Sep 11, 2018
manu.jpeg
Sep 10, 2018
3. Uprightness
Sep 10, 2018
Sep 10, 2018
IMG_2220.jpg
Sep 6, 2018
2. Manhole Covers
Sep 6, 2018
Sep 6, 2018
On+Board.jpg
Sep 5, 2018
1. Flying in Japan
Sep 5, 2018
Sep 5, 2018
Featured
2nd Carrier Kido Butai.jpeg
Dec 5, 2021
5 December 1941
Dec 5, 2021
Dec 5, 2021
NYT 1 Dec 1941.png
Dec 1, 2021
1 December 1941
Dec 1, 2021
Dec 1, 2021

Powered by Squarespace